There is a tendency among some investors to think of “energy” as a monolithic thing and assume that every part of the sector moves together, with the price of crude being the dominant force. To some extent, that is down to people like me who often, for reasons of convenience, talk about it that way.
That isn’t usually the case, though, and the last couple of months have demonstrated just how far off the mark it can be.
The main U.S. crude benchmark, WTI, has spent the last two months grinding slowly upwards in a pattern that is striking for its lack of volatility, while Henry Hub futures, the natural gas equivalent, have nearly doubled in price in the same time.
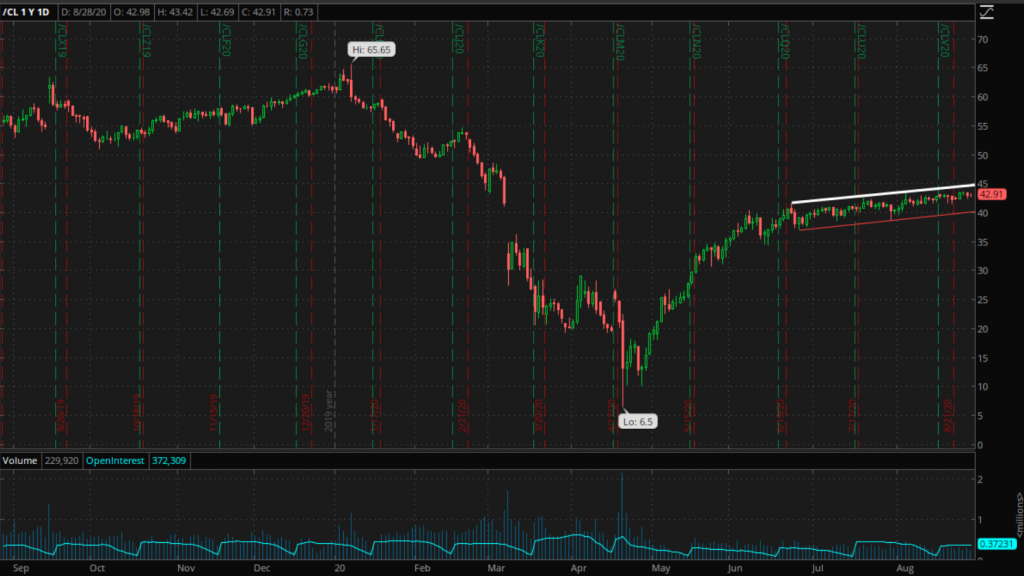
Figure 1: WTI Futures Contract CL. I-year/1-day chart.
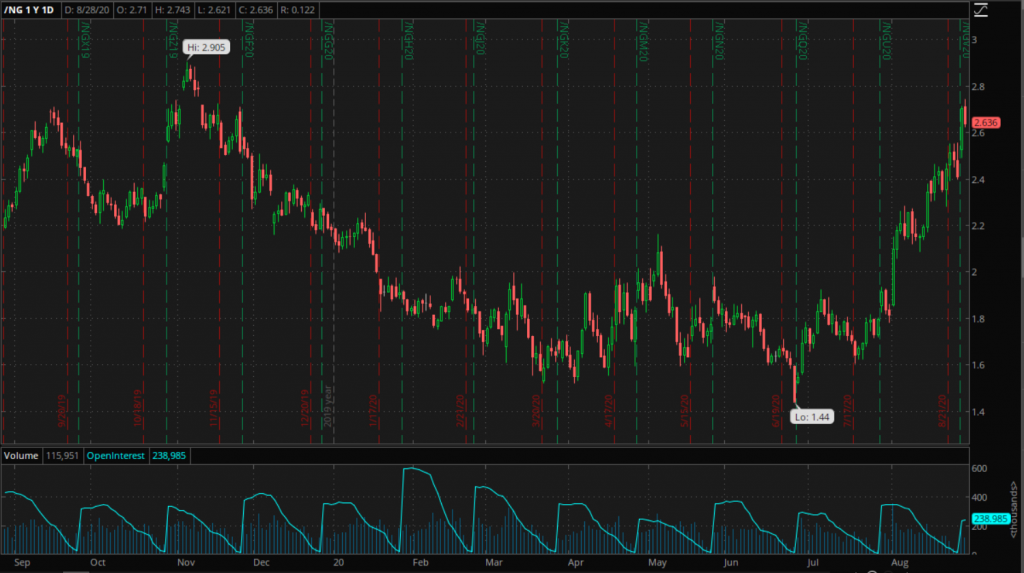
Figure 2 Nat Gas futures NG. 1-year/1-day chart.
An analysis of why sheds some light on what to expect from here…
Varying Influences
Although not as inextricably linked as some may think, the two major energy commodity markets do have some influences in common.
From a supply perspective, the two are often tied together. Most wells produce a mix of oil and gas, and a combination of environmental regulations and increased demand for gas have made it better for most producers to capture and sell the gas, rather than burn it off on site as was usually done in the past. Thus, as crude production shifts with the opening and closure of wells, so does natural gas production to some extent.
Then there is the demand side of the equation.
Prosperity and economic growth increase energy demand as a whole, for example, so both benefit from that. They are therefore both also sensitive to major economic data, both domestic and global. If, say, the U.S. jobs report were to be particularly good next week, indicating a faster than expected recovery from the coronavirus-led damage to the U.S. economy, both NG and CL would probably move up on the news, at least initially.
However, despite the similarity in terms of exposure to economic strength and growth, the demand profile for oil and natural gas are different. Oil is used primarily for fuel, including gasoline, diesel, and jet and marine fuels. Nat gas, on the other hand, is used increasingly for electricity generation, and for heating and cooling homes directly.
When you consider that, it isn’t hard to understand why, as the U.S. economy has recovered from the shutdown, the two markets have behaved so differently.
The Post-Covid Economy
In reality what the U.S. economy has done is as much about adapting to the post-Covid world as it is about recovering in the traditional sense. We still have massive unemployment and a lower GDP than before the pandemic, and what recovery there has been has been focused on specific areas.
I’m sure we all know by now what those areas are. E-commerce has dominated traditional retail, and anything related to working from home has boomed. Meanwhile, airlines and travel stocks are still depressed. A lot of people are still working from home for at least part of the week. That means less travel and therefore fuel consumption, and more home heating and cooling and electricity demand as we run computers and appliances.
That in turn means that domestic demand for natural gas has increased, while demand for oil has remained muted.
Further Evidence
Energy watchers have seen this week just how powerful those varying influences are.
The Louisiana and Texas coasts on the Gulf of Mexico, one of the most important areas for oil and gas production and refining in the country, faced an unprecedented potential calamity as two major storms entered the gulf at the same time. And yet, as that threat became known, WTI futures did this, even as the rig count declined again, another traditionally bullish sign on the supply side…
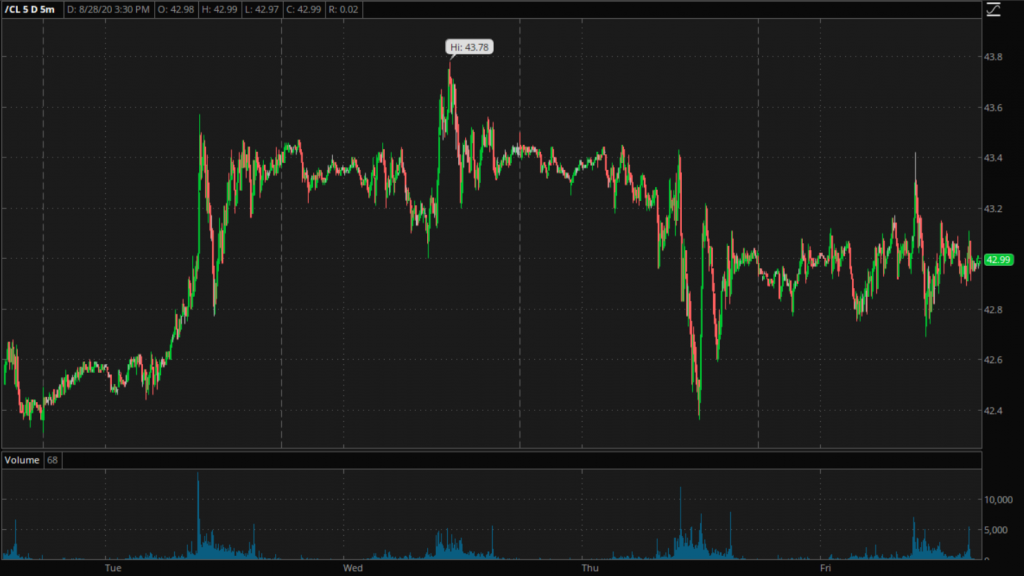
CL tried to respond in the traditional way to such a threat early in the week, but managed to climb only around a dollar, and gave that back on Thursday before the extent of the damage was known. It then barely moved on the rig data. That suggests that even in the face of a hurricane and potential major supply disruption, and with continuing domestic supply still falling, the prospect of continued weak demand is still driving crude.
To be fair, NG didn’t jump on the prospect of the storms either…
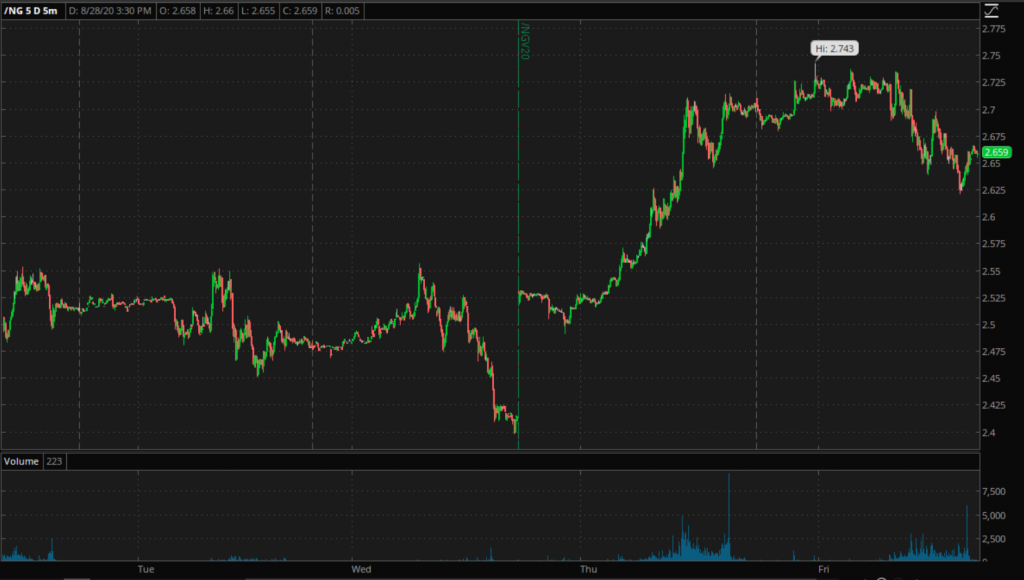
…but the difference is that when it was known that the disruption to the oilfields and refineries was going to be miraculously low, NG gained ground.
What It All Means for Traders and Investors
The first thing I take from this is that there is significant downside risk to oil.
If CL can look that weak given all the bullish influences, imagine what will happen when supply levels off, or if there is economic data that suggests a slowing or stalling recovery. That is why, even as I trade within the range, I am favoring the downside and protecting against a major break in that direction.
As for nat gas, as high and therefore vulnerable as it looks, it is hard to see any downward move gaining much momentum as long as the new economy is seen as favoring it from a demand perspective.
Perhaps the most interesting message from all this though is what it says about the stock market in general.
There, every bit of conceivable good news looks priced in. That doesn’t mean that stocks are about to collapse though. If progress towards recovery continues, then traders will continue the forward discounting, and we can continue higher still.
What it does mean, though, is that chasing the big returns by buying things like airline stocks and others that can only improve their outlook when normality returns may be a losing strategy for a while longer. And, as high as some of the recent market leaders may look, they can go higher still, assuming that Congress’s inability to agree on another stimulus package doesn’t cause a major reversal in the economy or deepen the cracks that are already there.
It is always tempting to think of both oil and nat gas as part of a bigger thing called energy, and to lump them in together. Indeed, there are many times when they do move in unison, such as the three or four months at the end of last year and beginning of this when both were falling. That, however, just makes it more interesting and significant when they diverge. As you can see, sometimes the reasons for that when it happens can inform strategies, not just for oil and gas, but for other markets too.
Cheers,